Automotive
Versatech Increased OEE 30%
Consumer Package Goods
Oral Biotech Eliminated Scrap
Food/Beverage
Louisiana Fish Fry Increases OEE 12%
Metal Stamping
H&T Waterbury Reduced Downtime 71%
Blow Molding
Lyons Blow Molding Automated Reporting & Labeling
The manufacturing sector has experienced a paradigm shift. With the advent of Industry 4.0, technologies such as AI, machine learning, IoT, and smart factory solutions have made their way into production lines around the globe. Digitizing data is no longer an expensive dream of the future, but a need of the present if businesses want to stay competitive. Before manufacturers can implement this technology, they need to take steps to modernize their data collection process into the production monitoring system.
Smart factories leverage software to capture data and analyze the results to make workers smarter and more efficient. The greatest benefit to data collection is visibility. Visibility is key for continuous improvement to see what’s happening right now, what happened last quarter and how to improve performance for tomorrow. Start simple, think big, move fast.
Any continuous improvement is in the dark unless metrics are established to define where you started. Creating structure and setting the metrics for success is the first step in creating visibility. Managing capacity on the factory floor starts with two data points: counts & downtimes.
These two data points are specific, measurable, achievable, realistic and time bound.
An operator can select this information on their Mingo Smart Factory console by selecting two buttons: what line is running, and when it starts/stops.
Tacony was able to get their backlog under control and reduce their lead time by 150% with Mingo Smart Factory’s insights into production, a standardization system in place, and an understanding of key metrics.
Capturing performance data is essential to know what lines are currently working and how much they are producing. Nothing is worse for a company than realizing at the end of a shift that one of the machines was down, waiting for a maintenance ticket. It can take an hour to walk the factory floor manually collecting counts or estimating the numbers from the end of the previous shift. Then the lucky intern or supervisor has to transfer those counts into an Excel spreadsheet that is so big that everyone is afraid to touch it lest they break the formula buried within one of the hidden tabs.
Manual data entry from a CRM to a field service software is a nightmare since it leaves room for mistakes, especially if data is updated in one of the systems later on. If the work still happens on paper and PDFs, it is impossible to drive any conclusions about how the work is getting done. Part of the continuous improvement process is having accurate and accountable data. Ice Industries uses automated reporting to get accurate data and manage the financials for five plant locations across two countries.
Busy is not the same as productive. The more data points companies can capture, the better they can understand the whole picture. Process data that is automatically collected from each machine has the potential to record more than counts and downtimes. It can compile temperature, humidity, vibration, speed, current draw, and flow rates. Basically anything that can be pulled from a machine to tell how it’s running.
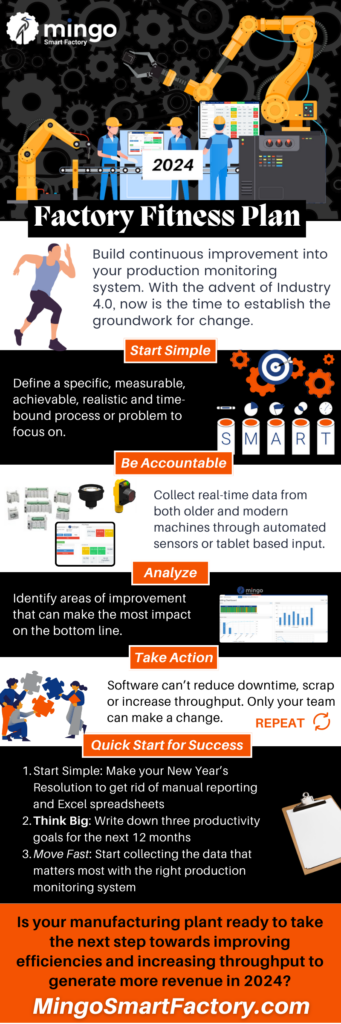
Once structured data is captured in a digital format, it’s time to start analyzing. A high level of productivity is synonymous with optimized processes, reduced waste, and increased profitability. H&T Waterbury in Connecticut was able to eliminate 18 hours of downtime and reduce micro stops by 71% by automating data collection and by setting up timely reports.
A Pareto Chart visually illustrates the most important factors for a dataset. Of the 80% of problems, what was the 20% causing them? The goal is to maximize productivity while minimizing waste, also known as lean manufacturing.
Most manufacturers start their analysis by calculating OEE (Overall Equipment Effectiveness). OEE is a measure of performance, availability, and quality. Using this number, operators and managers can quickly see how a machine or cell is performing and track how efficiently a part or product can be produced. Visibility into OEE downtime creates accountability and drives process improvement.
Because of the formula, Availability x Quality x Performance, any of these factors can vary and produce the same OEE number. OEE can be a very flawed metric if not understood and contextualized. For example: an OEE of 87% would infer that things are going well while in reality, the daily fluctuations are not what you want to see. Looking at a more integrated dashboard helps shift the focus to trends.
Visibility is only the first step of continuous improvement for the production line. Software can’t reduce downtime, eliminate scrap or increase throughput. Only the team can take the next step once issues have been identified to change processes and increase throughput. Start simple by identifying one process or problem to tackle.
Versatech was able to use Mingo Smart Factory to look at downtime and quickly solve issues as well as recognize negative trends. “We used Mingo to look at downtime and correlate instances of unscheduled downtime with specific events. We leveraged real-time data to look at machines as they were running on the manufacturing floor to ensure they were always running properly.”
Learn more about how Mingo Smart Factory works.

Built by people who know manufacturing, Mingo Smart Factory provides the 21st century “Smart Factory” experience that manufacturers need to grow in a modern environment. See how it can help you drive revenue.
© Copyright 2025 Mingo Smart Factory » Privacy
