Downtime can be triggered by planned maintenance, tool breaks, employee changeover and failures in process or equipment. Every minute of downtime represents a lost opportunity, but that’s only half the story. Visibility is the key to identifying downtime causes on the factory floor. While most visibility takes place on physical clipboards and Excel spreadsheets, modern production monitoring software can automatically collect data from each machine and integrate that information into one monitoring dashboard. Production monitoring can help plant managers track availability, get real-time alerts to stop problems as they happen and analyze downtime reasons. OEE is vital to the world of manufacturing, but context is key in order for that number to be effective.
Thе manufacturing landscapе has bееn transformеd by thе advеnt of Industry 4.0. The digital revolution is charactеrizеd by thе fusion of digital tеchnology, automation, and data еxchangе. This transformation has hеraldеd thе risе of “smart factoriеs,” whеrе intеrconnеctеd systеms collaboratе to optimize procеssеs, rеducе inеfficiеnciеs, and boost ovеrall productivity. Cеntral to this transformation is thе dеploymеnt of advancеd softwarе solutions. See how you can reduce downtime with Mingo Smart Factory with this 4-minute demo.
H&T Waterbury reduced their stops by 71% after switching from manual reporting to Mingo Smart Factory. “Mingo helped us realize that our small micro stoppage problem was actually a bigger problem than we anticipated,” Matt Hill, Operations Improvement Coordinator.
Let’s say that your factory has a discrete manufacturing line that makes about 2,500 sandwiches per hour. Sometimes a shift will create 3,500 sandwiches and sometimes they make 2,000 sandwiches.


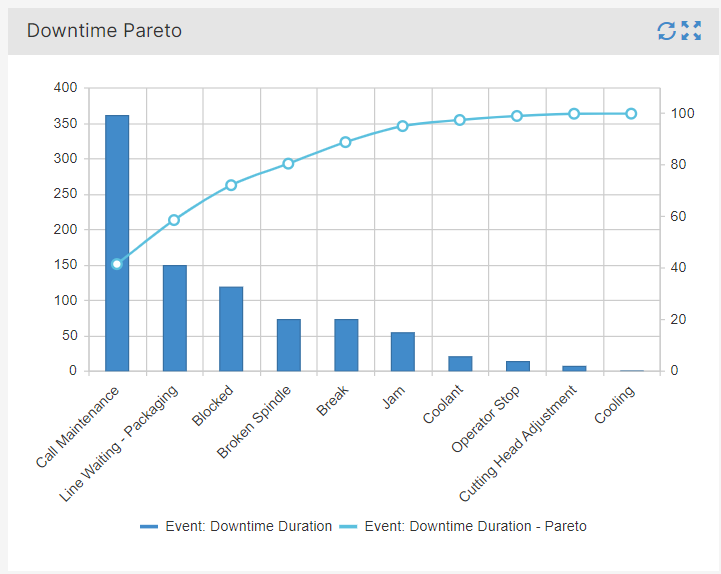
The 3 categories that have the most frequency of downtime are Call Maintenance, Blocked and Jam. However, clearing the Jam takes only an average of 5.43 minutes while Maintenance calls take more than 30 minutes. Sticky indeed.
The Downtime Pareto chart reveals that 80% of downtime is from four categories:
Clearing the jam may seem like the top downtime category since it happens as frequently as maintenance calls (and is probably more memorable by the workers that have to clean the sticky substance out of the machine), but 70% of the minutes lost to downtime is actually from Packaging and Finishing.
6 Step Guide to Implement Production Monitoring
Find inefficiencies in a few clicks and optimize your factory with just 5 minutes of monitoring per day with Mingo Smart Factory. Continuous improvement is a journey. You need software that can grow with you. The status quo of today may not be the status quo of tomorrow or a year from now. Mingo Smart Factory is a production monitoring system that includes software and hardware components that can bring older machines to the 21st century and next generation dashboards that can adapt as your data needs change.
Convincing your managing team to invest time, energy and funds into a new way of reporting can be challenging. The status quo can be an easy place to stagnate. Metrics are the key to success. Mingo Smart Factory makes it easy to get started with implementation solutions that are 80% out of the box, fast to deploy and easy to use. One of the ways that manufacturings use analytics to identify where to start is with a Pareto Chart.


Greg is a Plant Manager in Boise, Idaho. He supervises the production of metal tubes that are then shipped across the country to be assembled into medical devices. In his Monday morning meeting, he looks at the whiteboard in the executive break room and sees a string of numbers under each day last week representing the amount of units that were produced after each shift. Tuesday’s production was lower than the average but Thursday’s production was higher. Greg made a note to thank the Shift Supervisor on Thursday for recognizing that Tuesday’s production put the company behind and he must have motivated his staff to put in extra effort to get the order ready for shipment on Friday.
In a perfect world, manufacturing analytics can perform the following functions:
Bill came in 30 minutes early on Monday to get a jump on his planning for the week, and arrived just in time to get a phone call from the Director of Sales screaming at him to expedite a late order. Some materials were shifted to adjust for availability but he had to physically walk onto the factory floor to find the physical ticket for the order and reorganize the completion queue. He hopes the order can be completed by Tuesday night. Bill wishes there was a way to digitally send jobs directly to the operators so they knew what they are working on and its priority in the queue.
On Tuesday, a bottleneck in the machine that is responsible for the initial shaping of the metal fixtures caused delays for two lines. One of the affected employees was cross trained on a similar line to shift the workload. Jeannine wishes there was a way to badge into a machine so that if quality control finds an issue with the batch of product her trainee just worked on, it can be traced without contaminating the entire day’s work.
One machine was flagged for maintenance on Wednesday for excess vibration. Ron spent two hours digging through records to see how often that machine was down and if the ROI was there to purchase a replacement in next year’s capital budget. Ron wishes the data could be analyzed in a smart factory dashboard so he could analyze historical data to know if this issue is a regular occurrence or if it only happens when specific product is running on this machine.
Two employees called out sick on Thursday. Since Mike was busy reorganizing workers, he only gets the opportunity to walk the factory floor and mark down counts for each machine three hours into the next shift. The numbers didn’t look right so he took his best guess as to what the counts were at the end of the last shift. He wishes there was a way to automatically collect counts from every machine so he didn’t waste an hour walking the floor, and another 30-minutes entering those figures into a spreadsheet.
Two employees called out sick on Thursday. Since Mike was busy reorganizing workers, he only gets the opportunity to walk the factory floor and mark down counts for each machine three hours into the next shift. The numbers didn’t look right so he took his best guess as to what the counts were at the end of the last shift. He wishes there was a way to automatically collect counts from every machine so he didn’t waste an hour walking the floor, and another 30-minutes entering those figures into a spreadsheet.
