The Cause of Production Downtime In Manufacturing
Production downtime is one of the biggest problems in manufacturing. It is costly and damaging to all manufacturing businesses.
Production downtime is caused by planned maintenance, tool breaks, adjustments, and even bathroom breaks. Every minute a manufacturer’s machine isn’t up and running, there is a chance that revenue is lost. What’s more, unplanned downtime can be debilitating to manufacturers that rely on performance and quality to stay competitive in their niche.
Understanding what disrupts machine uptime is critical to preventing machine downtime and improving lean manufacturing processes.
OEE is at the Heart of Downtime
Overall Equipment Effectiveness (OEE) is made up of 3 basic components:
- Quality
- Availability
- Performance
All three of these things are disrupted when machine downtime occurs. Uptime and downtime metrics are actually fairly arbitrary (100% OEE is’t necessarily a good thing, either) if the data isn’t accurate. What’s actually is important is the improvement of these actual circumstances.
What do I mean?
Manufacturers should be more focused on machine downtime than whatever they believe are acceptable metrics for these sorts of events. Achieving industry-acceptable OEE or machine uptime metrics means nothing if you are losing thousands of dollars a day due to machine downtime.
How is Availability Affected by Downtime?
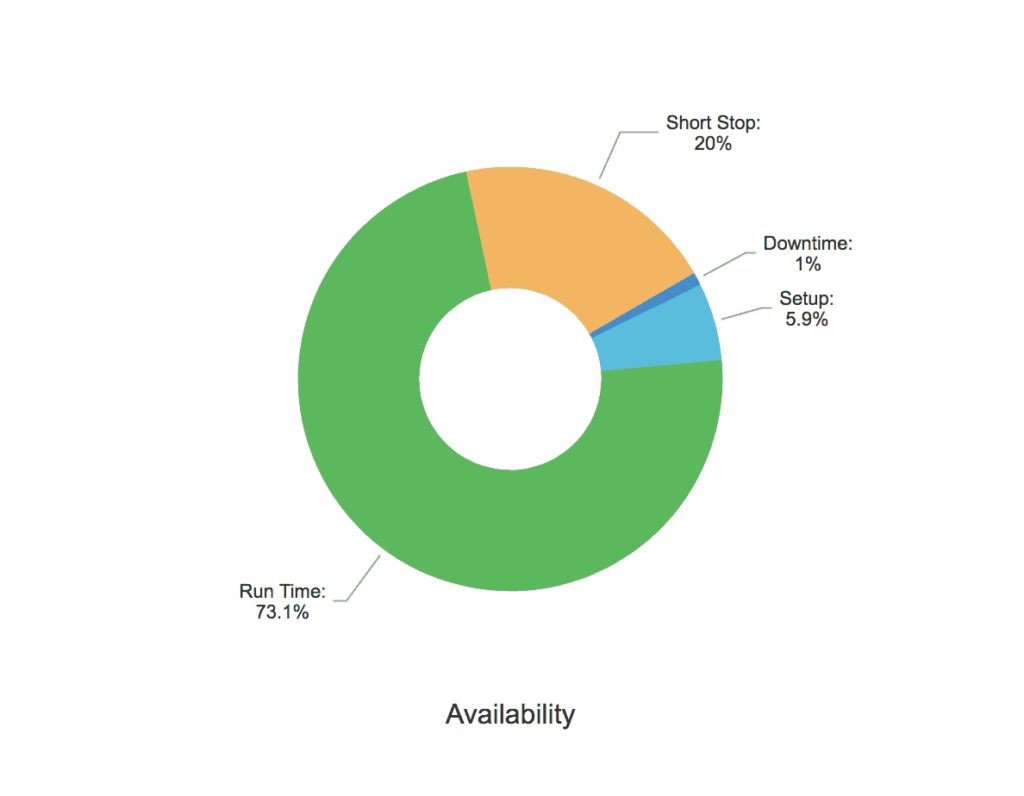
Availability is a measurement of the time the machine is running compared to the planned schedule. You have to measure it accurately to reduce downtime.
To determine the availability of a machine or cell, you need to collect data directly from the controls or PLCs on the equipment. However, this typically isn’t enough on its own.
Manufacturers must also augment this information with input from operators or supervisors to gather context around specific events.
Without human input, you may not understand why shift changeover is taking 15 minutes longer than planned. If all you know is that machines are going down 15 minutes longer than the schedule has planned, how will you ever troubleshoot that issue without that missing piece of human data?
Answering these questions, gaining this context, and solving these problems is the first step towards eventually automating these things.

What are the Top Causes of Downtime and What are Top Downtime Trends?
Context is key to improving machine downtime. Understanding when the machines are up and when they are down is really important; however, what’s more important is being able to understand why they are up and down in the context of history.
We can dive further into the details, looking at individual downtime events to see how long they lasted, if we have the right data to accompany these actual events. This is where human data comes into play.
If we have inputs from all the parties experiencing the downtime (the people on the floor), we can have a much better context as to why it is occurring.
For example, if downtime is 3x as high during the 3rd shift, we will want to know why. Perhaps we find out that it is because of common issues like:
- Changeovers
- Cleaning
- Tool changes
- Early shutdowns
- Personal breaks
These events are common, but if they are out of line with planning or other shifts, we can fix this.
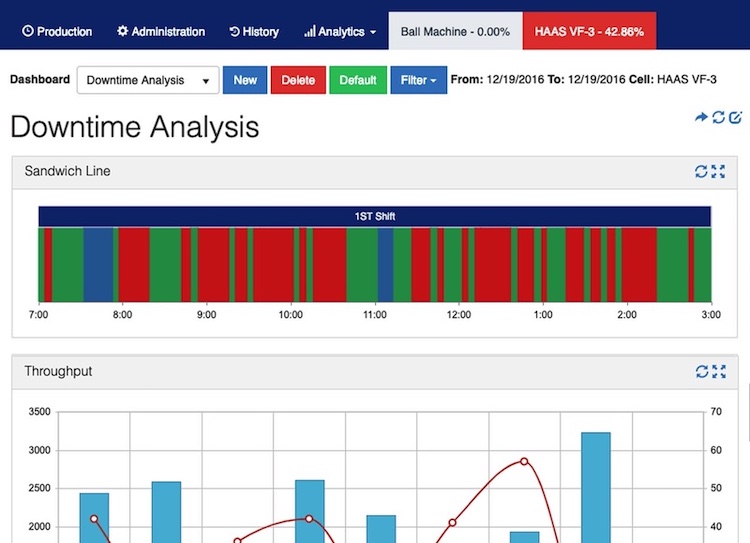
Manufacturers need to track trends in data that allow them to see how the plant is running over a period time. Using historical trends, you can easily see the effect of process or system changes over the long term. You can also notice when downtime is increasing or decreasing and quickly take action to resolve the issues.
Does Scheduled Downtime Affect OEE?
Manufacturers often wonder how scheduled downtime affects OEE since downtime can be a reflection of production inefficiency. In reality, unplanned downtime has the greatest negative impact on manufacturing efficiency and should be reflected in how OEE is measured.
If downtime is unplanned or unscheduled that means that one part of a production line, machine cell, or even an individual machine, is operating outside of the business’s planned manufacturing process.
Below, I will highlight a few of the nuances of this subject and highlight how manufacturers need to consider downtime when calculating OEE.
How Do you Conduct Production Downtime Analysis and Calculate Scheduled Downtime?
Keeping downtime analysis focused on unplanned instances gives manufacturers better visibility into what their potential production efficiency looks like.
Knowing when the machines are up and when they are down is paramount to being able to understand how well you are producing to plan. It also helps you see the amount of waste (financial, product, you name it) that occurs inside the manufacturing process as well.

Being able to parse through the nuances of your downtime with a machine downtime tracking template will give you a much greater level of understanding in what you really want to know: “Are we missing something that is causing us to waste time and money”?
If you’re managing your company on an OEE number or an availability number, marking downtime as planned doesn’t point out the fact that you could actually run when a machine is not scheduled.
What is an Example of Monitoring Downtime and Calculating OEE?

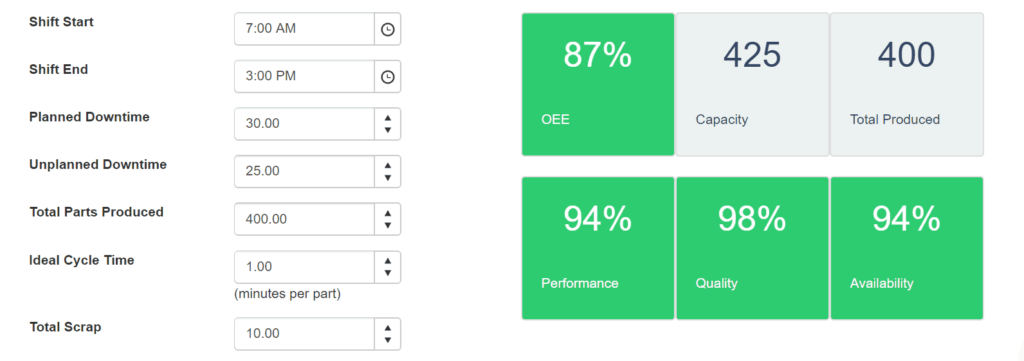
EXPERIMENT YOURSELF: Try our free OEE calculator to enter some unplanned production downtime into the unplanned downtime field. Then, look at the availability number. Next, take out that unplanned downtime and look at the availability number, you’ll see how it potentially hides the additional time you could be running.
How Should I Look at OEE and Production Downtime Loss?
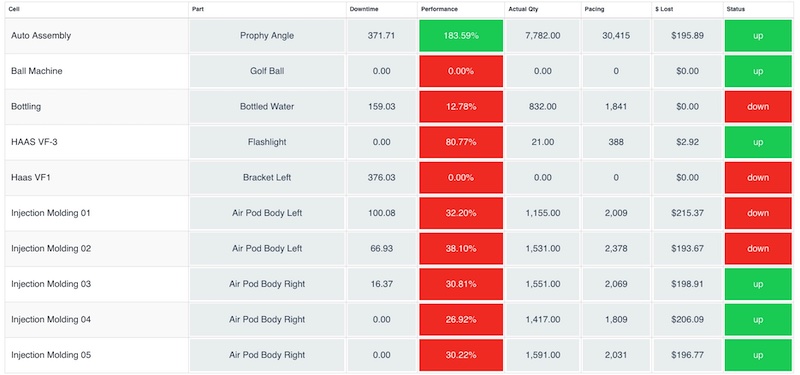
Being able to see how the machines are running, and how production lines and planned processes are executing according to the schedule, process, or plan, will provide insights for every manufacturer that is unique.
Manufacturers with strong factory floor visibility can quickly identify error codes or machine issues as they happen and can address issues before the time for ROI is lost.

Being able to look at OEE in a granular fashion opens up your ability to impact overall performance to a much greater degree on the factory floor. This is true for real-time issues with machines and systemic issues that may be the result of operational practices that are typically unseen.
OEE is not a magic number that every manufacturer should simply optimize around to achieve the best possible results. The number itself is arbitrary to the relative improvements each individual manufacturer can make. Let me explain a little bit more.
What is the Real Reason for OEE Downtime Loss?
Unplanned downtime directly impacts one of the core measurements of OEE, availability.
Availability represents how much time a machine can run. It should include planned and unplanned maintenance, waiting, changeovers, and lack of supply. Using reason codes to track downtime, companies can determine root causes and develop corrective actions to stop these issues from occurring in the future.
The problem is when manufacturers have unplanned downtime that can’t be accounted for or explained. This can make availability worse, or inaccurate. Both are bad.

What’s more, unplanned downtime that cannot be tracked, explained, or measured properly can affect the other components that make up OEE as well, performance and quality. This means that the ability to accurately understand and account for unplanned downtime is paramount in understanding your true OEE.
There’s not really a good or bad OEE, just one that is relative to your business. The real power comes in having an OEE number that accurately represents how your shop floor is running when everything is accounted for.
Having this kind of insight into your downtime will provide manufacturers with a clear picture of ROI once they correct systemic issues. The improvements in an OEE number can be quantified to a much better degree once you have all the machine data that matters.
What OEE Downtime Model is Best?
If you want to know if you should measure scheduled production downtime when calculating OEE the answer is, yes. But, that isn’t as important as being able to accurately account for all downtime, planned and unplanned. Understanding how downtime actually impacts machine availability will offer far better ROI in the long term and will provide a much more accurate and actionable OEE number for your business.
If you have additional questions about calculating OEE, the cost of OEE, or general OEE software reach out to us. We’re happy to talk all things OEE. Additionally, if you’re interested in calculating OEE, you can use our free calculator or cycle time formulas here.
Stop Guessing, Start Knowing
The top problem that manufacturers have with production downtime is what I like to call the conspiracy theory model. They have metrics that aren’t actually tied to objective data straight from the machine and they blend that with platitudes and subjective data from different parties within the business to get a fairly inaccurate picture of what is really going on.
What is needed is a more objective historical view of what’s going on (data right from the machines), augmented with the reality of what happened in those moments (straight from the plant floor) that can help provide real context to the negative events.
This what will ultimately give manufacturers the ability to move away from conspiracies and towards a more data-driven business.
Mingo is a really easy way to do this. In fact, we’ve never had a customer stop using Mingo after buying it. How about that!
Software Can’t Reduce Downtime… But This Can…
A couple of weeks ago I was meeting with the VP of Operations at one of our customer’s plants. He said something interesting. “Software can’t reduce downtime, scrap or increase throughput only my team can do that”, he shared.
“What your software does is solve a problem every manufacturer has: visibility. Every manufacturer lacks visibility into what is happening in the plant and that is what you give them visibility into their operations.”
He was right, manufacturing analytics software can only show you where the issues are. Manufacturers still have to take action to fix them.
Once a problem is fixed the software can help you make sure it stays fixed and the problem does not come back. But, the manufacturer still has to do the work.
The ROI of Shared Information
When I look over our customer base and think about which companies are the most successful and are getting the biggest ROI out of the software it is the companies that share the data with everyone. They have integrated Mingo into their daily production meetings, they have dashboard subscriptions sending the right people shift summaries and weekly summaries of what happened on the floor.
These manufacturers setup alerts if downtime exceeds a certain threshold to make sure machines run when they are supposed to and are not overlooked when they are having problems.
See how you can reduce downtime with Mingo with 4-minute demo.
This creates the visibility we talked about above and it creates alignment between the different teams engineering, maintenance, quality, and production on what are the most important problems to attack.
The Power of Visibility on the Plant Floor
Real-time visibility helps companies stop problems before they start – or an entire shifts production is lost.
How many times has a machine not run an entire shift and no one knew about it until that shift was over? This is the tip of the iceberg,
That doesn’t happen for our customers. Too many people would know and be able to step in to fix it.
Manufacturing Analytics software is a tool, any company that tells you it is an easy button to reduce downtime, scrap, etc. does not understand manufacturing.
We can give you the data and make it easy to understand but to get the real ROI out of the software but manufacturers still have to take action.
This is why software ultimately can’t reduce production downtime.


