
Although Industry 5.0 is regularly discussed, many manufacturers are still operating with technology based in Industry 3.0. Pencil, paper and Excel are still the norm in an age of AI and robotics. A 2022 iBaseT study of 202 US manufacturers found that 86% believe that discrete manufacturers will cease to exist i the next 10 years if they innovate. Staying competitive means more than just producing goods efficiently in today’s fast-paced manufacturing floor. It requires leveraging the latest technologies to optimize processes, increase productivity, and adapt to changing market demands. According to BCI’s 2023 Supply Chain Resilience Study, 59.8% of respondents replied that Excel spreadsheets remain the most popular indicator to record, measure and report on supply chain disruptions.
Contrary to popular belief, using a more advanced system does not require a Ph.D or an understanding of rocket science. The best manufacturing systems are easy to use and can be understood by everyone from upper management to interns. A human brain processes an image 60,000 times faster than text. When working on a time sensitive process with the goal of getting as many high quality materials produced as possible, wouldn’t you rather see what’s next at a glance? It’s much easier to evaluate what’s going on with a visual dashboard than a paragraph of text.
Manual Reporting is Time Consuming
Imagine the process: a manager spends 45 minutes walking the factory floor and writing down counts on a clipboard. That clipboard is handed off to an unfortunate intern who spends the next hour painstakingly transferring each number into an Excel spreadsheet that is older than they are. Desperately hoping that they don’t break the formula that is buried within one of the tabs. A week passes before this data is analyzed by upper management. There is a better way.
Getting off of paper tracking and spreadsheets reduced overtime labor costs and ultimately improved the accuracy of Versatech’s data. Versatech Manufacturing Engineer, Scott Strutner used Mingo Smart Factory to look at downtime in real-time so that they could fix issues as they happened; not down the line when the opportunity for savings and improvements were lost. “This really helped us focus on – and improve – uptime”, said Strutner.
At the heart of this digital transformation is the conversion of raw data—often represented as ones and zeros—into visually intuitive displays that provide actionable insights across all levels of the organization. One such transformative tool is the integration of production monitoring systems with visual dashboards, which harness the power of data to drive real-time decisions and unlock new business opportunities.
Here are a few ways that visual dashboards can revolutionize manufacturing operations:
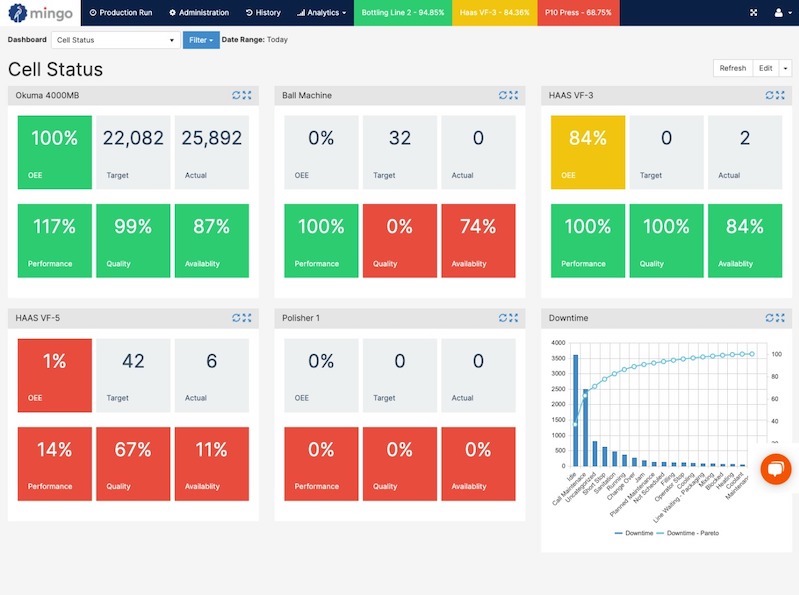
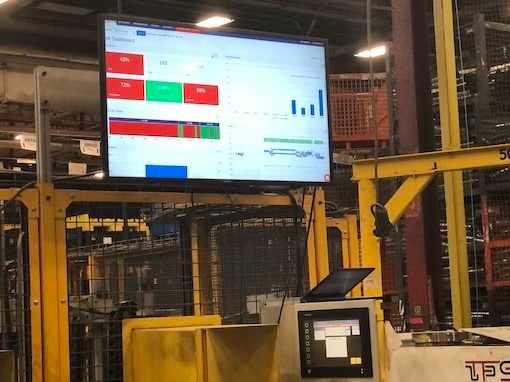
1. Live Scoreboards for Operators:
Visual dashboards provide operators with real-time visibility into key performance metrics such as production rates, downtime, and quality indicators. By presenting this information in an easy-to-understand format, operators can quickly identify any issues and take corrective actions to keep production running smoothly. No wordy text or printed spreadsheets that end up in the recycling bin five minutes after they enter the factory floor (if they make it that far!).
Louisiana Fish Fry has scoreboards set up on television screens around the plant helped workers see when they were doing well (green light) and when there was room for improvement (red light). Self-motivating the staff has been a key management strategy for high quality products.
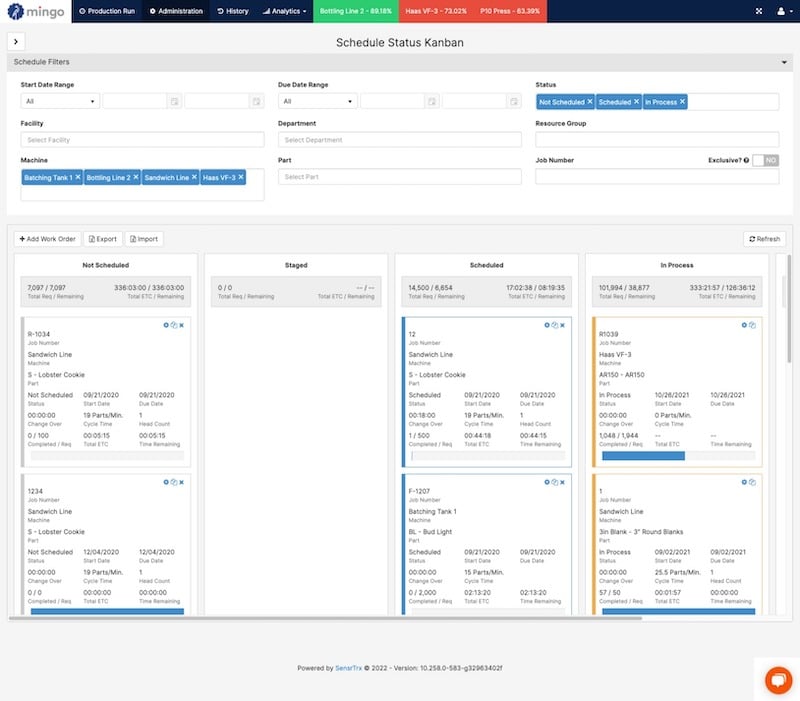
2. Dynamic Scheduling:
With a visual dashboard, scheduling becomes more than just assigning tasks; it becomes a strategic tool for optimizing production workflows. Operators can see what jobs are next in the queue, adjust priorities based on changing demands, and allocate resources more effectively to meet delivery deadlines.
Traditionally, manufacturers have used scheduling within the ERP to figure out what they should make based on inventory levels, sales order demand, forecasting, and a few other variables based on the availability of raw materials. Then, they decide what to build. It can lead to overproduction and producing the wrong parts and simply, not having the right parts. This is all too common and importing your scheduling from an ERP is just not enough.
Manufacturers typically want to run as lean as possible so there is a minimal amount of inventory taking up space in the warehouse. If you keep a small amount of stock to ship to your customers, and you use Kanban signals when inventory gets low, then you’re scheduling work based on the actual demand of the customer rather than to a forecast or what you think you need. Simple, easy and based on real-time data, not historical numbers or a gut check.
3. Enhanced Quality Control:
By integrating quality control metrics into the dashboard, manufacturers can monitor product quality at every stage of the production process. Any deviations from quality standards can be detected immediately. This allows for prompt adjustments to prevent defects and ensure customer satisfaction. Wouldn’t you hate to destroy an entire day’s worth of product for a defect when an accountability system can isolate the problem to a single batch?
Lyons Blow Molding improved their accuracy by automating their data collection process. With real-time reporting, they could trace a part from the original material to the final shipment and print a label for it. The operator takes that label and applies it directly to the box and moves on to the next task. No delay, no confusion, and no mix-ups.
“[Mingo Smart Factory] gives us good traceability – the line it was made, the time printed, and unit number. We no longer have to worry about label mismanagement on the floor, incorrectly labeled products, or mixed load issues. This has improved accuracy and reduced mistakes,” Dave Aquilina, Director of Operations.
4. Efficient Line Configuration:
Visual dashboards enable manufacturers to optimize line configurations to minimize bottlenecks and maximize throughput. By analyzing real-time data on machine utilization and production rates, operators can make informed decisions about line setups and resource allocation to improve overall efficiency. All data is pushed into the cloud where it can be collected into a customizable dashboard. In the event of a power or network outage, the information remains stored on the local server until service is restored.
Look at each station individually or the line as a whole. Mingo Smart Factory gives you the ability to work the way you want and need to work, rather than bending to the system. Before working with Mingo Smart Factory, Ice Industries might write off $60,000 – $100,000 of inventory to balance the books for a plant. On its last inventory physical, the write off for the same plant location was $0. “Knowing that your inventory is accurate the whole time that you’re using the system is real dollars.” Bennett Bishop, Director of Operations & Finance.

5. Integration with ERP and CMMS Systems:
Visual dashboards streamline operations and maintenance processes. When a machine falls outside of temperature or vibration specifications, the system can automatically generate preventative maintenance tickets, reducing the risk of unplanned downtime. Mingo Smart Factory seamlessly integrates with Enterprise Resource Planning (ERP) and Computerized Maintenance Management Systems (CMMS) like Fiix.
Mingo Smart Factory and Fiix created a native integration to provide insight and create communication between operations and maintenance. H&T Waterbury is able to move towards condition-based maintenance, improve communications between teams, and diagnose and solve problems. This data is transmitted to Mingo to understand trends in temperature and vibration. In Fiix, the maintenance team can schedule maintenance activities, track inventory, and maintain workflow.

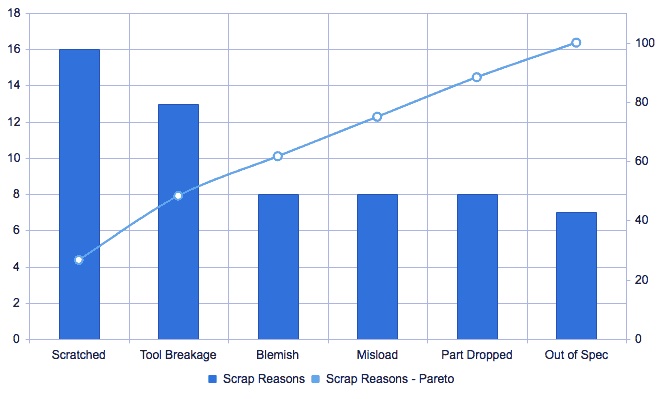
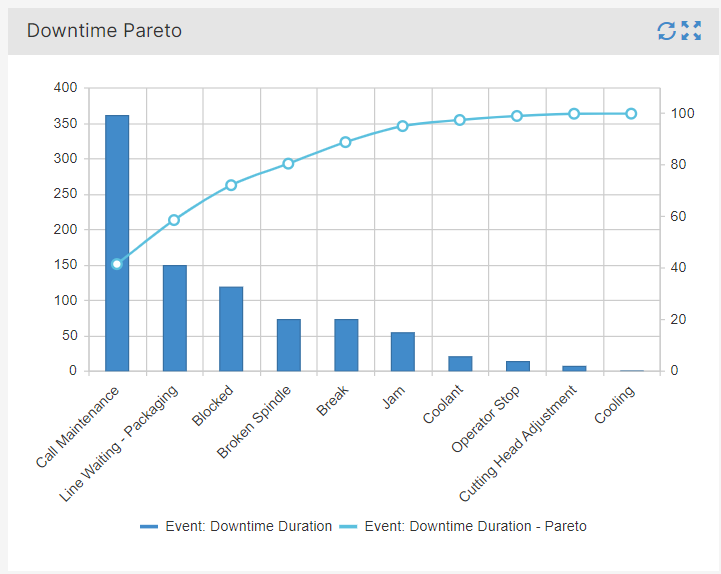
6. Minimizing Downtime with Pareto Charts:
Visualizing downtime data using Pareto charts allows manufacturers to identify the most common causes of downtime and prioritize efforts to address them. By focusing resources on addressing the root causes of downtime, manufacturers can minimize disruptions and improve overall equipment effectiveness (OEE). Simple to use and easy to customize for your unique needs – no dedicated IT department or code needed.
Find inefficiencies in a few clicks and optimize your factory with just five minutes of monitoring. Continuous improvement is a journey. You need software that can grow with you. The status quo of today may not be the status quo of tomorrow or a year from now. Mingo Smart Factory is a production monitoring system that includes software and hardware components that can bring older machines to the 21st century and next generation dashboards that can adapt as your data needs change.
Convincing your managing team to invest time, energy and funds into a new way of reporting can be challenging. The status quo can be an easy place to stagnate. Metrics are the key to success. One of the ways that manufacturings use analytics to identify where to start is with a Pareto Chart. The Pareto Chart identifies the top 20% of issues that are contributing to 80% of your downtime. Make the most impact with a few simple changes.
7. Automatic Reporting and Analytics:
Visual dashboards provide instant access to manufacturing analytics, enabling stakeholders to identify trends, patterns, and areas for improvement. Automatic reporting features allow for regular monitoring of key performance indicators (KPIs), facilitating data-driven decision-making and continuous improvement initiatives. These reports can be automatically sent by email or mobile alert.
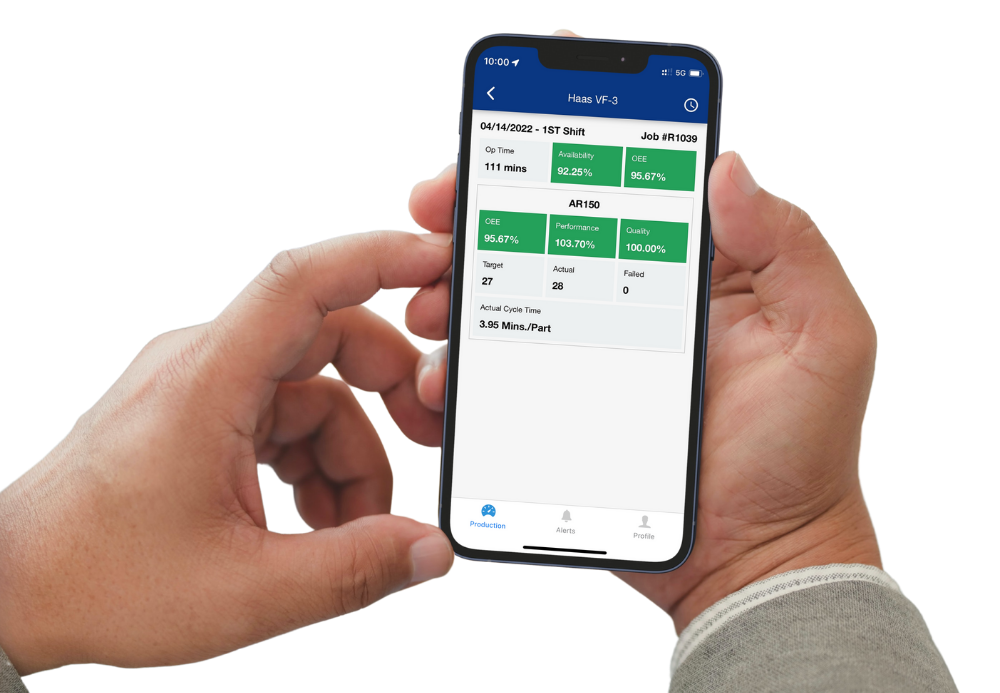
Mingo Smart Factory customers can monitor plant operations through the mobile app. One of Mingo’s mold injection customers recently used the app for more than production monitoring. One of their machines was flagged for quality issues on a Friday. The manager tagged the machine as down, then logged out for a restful weekend.
The same manager received a mobile alert on Saturday morning when that same machine had been turned on by the weekend crew. He was able to quickly contact the shift manager to turn the machine back off. This action prevented thousands of dollars of defective product. The company would have never known that the machine had been accidentally incorporated into the weekend’s line production without the mobile app.
The integration of production monitoring systems with visual dashboards represents a significant opportunity for manufacturers to unlock new business opportunities through digital transformation. By transforming raw data into actionable insights, visual dashboards empower operators, managers, and decision-makers to optimize processes, increase productivity, and drive continuous improvement across the factory floor. As the manufacturing landscape continues to evolve, embracing these technologies will be essential for staying competitive in the global marketplace.
Are you ready to see if Mingo Smart Factory is the right fit for you? Click here to watch a demo.
