Automotive
Versatech Increased OEE 30%
Consumer Package Goods
Oral Biotech Eliminated Scrap
Food/Beverage
Louisiana Fish Fry Increases OEE 12%
Metal Stamping
H&T Waterbury Reduced Downtime 71%
Blow Molding
Lyons Blow Molding Automated Reporting & Labeling
Imagine you just received an email offer to save $100. If this was $100 off of your weekly grocery bill, you might be jumping up and down in joy. But if this was $100 off of a $3,000 car repair, you may be less enthused. Why does the same amount of savings mean less in one scenario: context.
Visibility helps us see the whole picture and what is happening on the factory floor. Context is the measurement to determine how changing one variable will affect those operations. Getting the most return on investment (ROI) can be measured in several different ways: from the dollars that are spent to the synergy generated by the team. This article will break down three ways to evaluate ROI when selecting a production monitoring system for your factory:

Every manufacturer needs one thing: visibility.
The main idea for all manufacturers is to have access to data and real time visibility into their plant. By monitoring the machines on the plant floor for real-time data analysis, they can see what’s really happening. The goal is to use that information to solve issues on their own to the best of their abilities, as each manufacturer is unique and has different needs.
Mingo Smart Factory software is easy to implement, and it connects the entire organization with the right data for each person’s role. The value of the software is determined by our clients, as they know what they need and how they intend to use it.
To get to know potential clients, we ask questions about how they plan to use the software to tackle the issues that need to be addressed. This helps set the tone and start things off in the right direction. Every business wants a return on their investments, and investing in smart factory software and manufacturing analytics is no exception.
Calculating the ROI of using smart factory software can be complicated. The reason for this is that each manufacturer is unique and has different goals. This can make it challenging for organizations to determine the best course of action. To overcome this challenge, it’s crucial to identify the issues afflicting the factory and determine the goals necessary to solve them.
One of Mingo Smart Factory’s cannabis customers wanted to trial a new labeling vendor. Using A/B testing, they were able to determine with the Mingo dashboard that the vendor was not a good fit for their operation.
Lean manufacturing focuses on eliminating waste (overproduction, waiting, transportation, defects, etc.) and streamline processes for efficient resource utilization.
Maximizing ROI in manufacturing involves a continuous cycle of reducing costs, optimizing processes, and increasing profits. No change can exist in a vacuum. Change is not just about one action, but a strategic approach across multiple dimensions. Focusing on insights from your manufacturing analytics are the key to generating context and maximizing ROI. That’s why it’s important to look at the manufacturing process as a whole.
Customers save an average of 10 hours per week per shift when switching from manual reporting to automated data collection. Elsa used the Mingo Smart Factory dashboard to reduce their short stops from 30 minutes to 5.
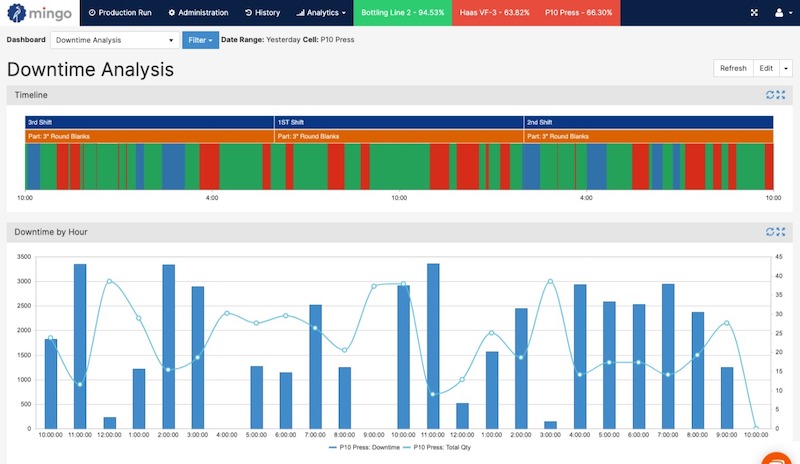
H&T Waterbury reduced their micro stops by 71% based on data collected from the floor. Unplanned shortstops in the high volume, high-speed facility were known to cause scrap, unplanned overtime, and increased costs downstream, but how often these unplanned downtime events occurred was unknown.
Versatech was able to use Mingo to look at downtime time and quickly solve issues as well as recognize negative trends. They used Mingo to look at downtime and correlate instances of unscheduled downtime with specific events.
Time can also be saved by reducing the bumps that occur during shift changeovers. For example, one of Mingo Smart Factory’s paint supply customers realized that sometimes their morning shift was delayed for up to two hours. The reason: operators were wasting time trying to figure out what happened during the previous shift so they could pick up where the most recent job ended.
Tacony was able to reduce a 14-week backlog in their West Chicago furniture plant by standardizing their practices and understand key metrics with the help of Mingo Smart Factory. A company is only generating revenue when they deliver the final product. Excess inventory may contribute well to productivity metrics, but it does not generate revenue.
Reducing the time it takes to produce product can mean the difference between overtime or an additional shift.
Let’s assume the following production scenario:
How much could you save by eliminating 12 minutes of downtime per machine?
(12 minutes x 10 machines)/60 minutes = 2 Hours Saved per Day
$75 Hourly Production Cost x 2 Hours Saved Per Day = $150.00 Saved per Day
Production monitoring software should:
One of Mingo Smart Factory’s mold injection customers recently used the Mingo mobile app to track quality issues in their plant. When a machine that had been flagged for maintenance issues was turned on over the weekend, the manager was able to alert the weekend manager. This move prevented thousands of dollars of defective product.
Performing well on OEE does not necessarily mean that the plant is profitable. Production monitoring software should show the whole picture for real time visibility.
Having an accurate inventory provided Ice Industries good data to manage from a financial standpoint on specific part number costing and labor absorption. They use Mingo’s dashboard to unlock hidden capacity.
Lincoln Plastics discovered the cycle times they were using to plan, cost, and quote their parts were off by as much as 40%. They were able to adjust their numbers to gain an understanding of their true capacity, actual cost, and which parts were actually profitable.
Mingo Smart Factory’s production monitoring software is, “intuitive and simple enough to make adjustments that are applicable throughout the platform.”
Being able to quantify those OEE numbers led to real dollars.
Calculate your return on investment from implementing smart factory software.
Every business wants a return on investment, and an investment in manufacturing analytics is no different.
But, success with manufacturing analytics doesn’t look the same for everyone. If you were to ask ten of our clients what they were originally looking to accomplish with Mingo Smart Factory, you might receive ten different answers.
In some companies, the focus is cost reduction while for others, it’s increased revenue. It’s easy to assume that machine availability will contribute to increased revenue, maybe it’s scrap, or it’s throughput, and it’s true that machine data analytics can help solve those specific issues.
What we’re finding, though, is that just because we have a customer who was able to increase their throughput by 30%, doesn’t mean that everyone else can do the same. It’s all relative.
Which makes you ask yourself, “What is the ROI for my company, specifically?”
If you know manufacturing analytics is the solution for the problems you’re facing on the floor, and you know it will prove to be successful for continuously improving, how do you prove ROI?
Below, we will look at each component in detail and determine how to calculate ROI in your factory. With formulas and examples, you’ll have that answer in no time.
ROI calculations can get very complex when trying to model exactly what happens in the business. As you go through the ROI calculator, remember that the formulas and examples serve as guidelines and are not conclusive.
Reduce downtime, increase utilization, increase availability; these are the most common, and easiest, places to look for cost savings, but there are additional components that manufacturers tend to overlook.
There are five different areas included in the ROI calculator where companies can see cost savings or increases in production which can allow for increased sales:
Determining how to improve one or more of the parts above contributes to the ROI and overall justification for implementing manufacturing analytics.
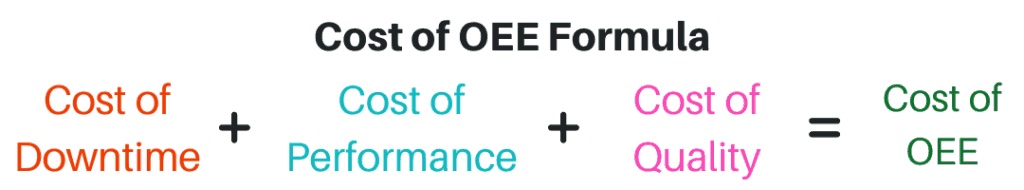
The formula for this is very simple to calculate.
Before we jump into the ROI calculator, you need to understand and think about three things:
Those three questions help you evaluate your particular situation. While calculations vary from manufacturer to manufacturer, knowing in the back of your mind the answers to the questions above will help to frame the issues your facing and concentrate on the ones that will be most relevant and deliver the highest ROI.
For the sake of the examples given throughout the page, let’s assume:
Soft costs are things like labor required to collect and process the data from the plant.
For example, if the operators write down production totals and downtime on a whiteboard each hour, then a supervisor collects that data on a clipboard and gives the clipboard data to someone in the office who then compiles that data into an Excel spreadsheet, and emails the spreadsheet to the team.
How much time does that take for each one of these people each day or week? What is the effective hourly rate for each person including benefits?
It’s likely time consuming and costly. There’s ROI just in automating data collection because employees are now given the opportunity to focus on their specific role, not transport data throughout the plant. Any minor improvement you make on top of that is just an added bonus. Even for people that aren’t collecting data, hiring a specific person to do what Mingo does is costly. Either way, data is needed. It’s how you collect data that will deliver a positive ROI.
We’re leading the ROI calculator with soft costs because frankly, they are a constant for every manufacturer. These costs are also a surprisingly important pain point for many companies; they feel very frustrated by their inability to focus on solving issues because of how long they feel they have to spend getting the data in the first place.
Assumptions:
Soft Costs ROI Calculation:
Operator: $15 * (30/60) = $7.50
Supervisor: $25 * 1 = $25
Office Staff: $25 * 3 = $75
Total: $107.50
($107.50 – $57.69)/$57.69 = 85.34% ROI
85% return on investment might seem low in this example, but that is only for one shift. If you had two or three shifts, your savings increases by two to three times while costs remain the same.
When you combine cost-savings with all the other gains outlined below, it makes for a very compelling ROI. Consider soft costs a baseline you can add additional savings on top of.
Reducing downtime and increasing availability and utilization are relatively the same, but companies often think about them differently.
For example, machine shops are interested in utilization. If they can increase utilization, they increase direct labor absorption, paying employees to add value by making parts, which lowers their costs. It also gives them more flexibility about what they can run, when, and where.
A quick note before we move on to the calculation:
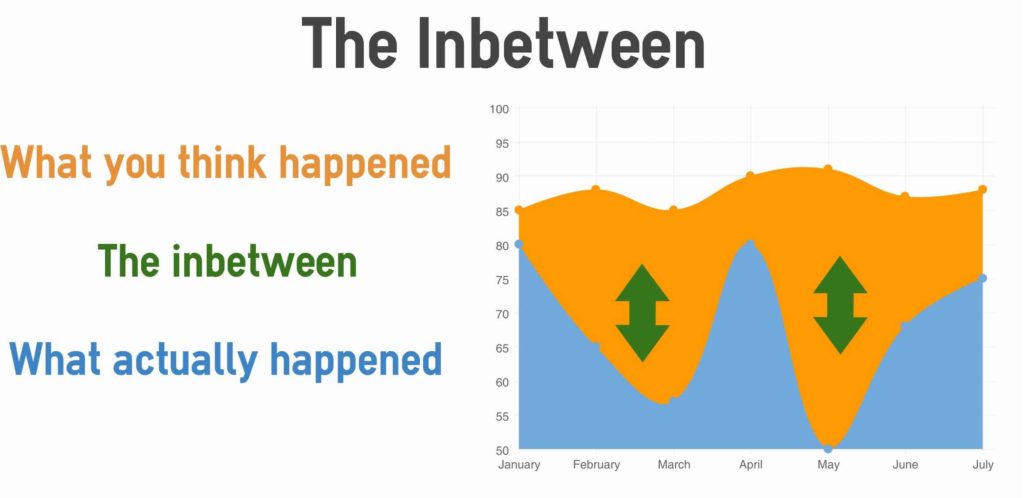
Many software companies talk about reducing downtime by 10%, but there’s 1 major problem with looking at it that way. Most companies without systems like Mingo Smart Factory have no idea how much downtime they really have. If you don’t have a baseline value of downtime, how do you know what reducing machine downtime by 10% would really look like?
This is why, in this case, manufacturing analytics is important to gauge increases in performance. (And, why proving ROI is simple.)
Our take is to look at it in two ways:
1. You can start day 1 with manufacturing analytics by setting up alerts or getting visibility into when a machine goes down. Both allow you to reduce your response time, effectively reducing downtime.
2. The other is looking at how much downtime would need to be eliminated per machine per day. For example, after looking at the contextualized data, you realize you spend 30 minutes per day waiting for the glue to get to temperature, and making that process faster has saved a ton of money.
Both reduce downtime and are much more real and concrete, than trying to reduce downtime without any tracking system in place.
Here is how to use the ROI calculator to determine downtime ROI:
Gains calculations:
Putting it all together: (Daily Savings – Daily Software Cost)/Daily Software Cost = ROI
Assumptions:
Downtime ROI Calculation:
Example 1: Let’s calculate the ROI when we eliminate 7 minutes of downtime per machine.
(7 * 10)/60 = 1.6667 Hours saved per day
$75*1.6667 = $125.00 saved per day($125 – $57.69)/$57.69 = 116.67% ROI
Example 2: Let’s calculate ROI when we eliminate 12 minutes of downtime per machine.
(12 * 10)/60 = 2 Hours saved per day
$75*2 = $150.00 saved per day($150 – $57.69)/$57.69 = 160.00% ROI
Reducing changeover time is very similar to reducing downtime because changeover time is a type of downtime. The formulas are the same, but the one difference is the input in the number of minutes on average you can reduce your changeover times.
For example, if you can reduce changeovers from 45 minutes to 27, the formula would look like this.
Reduce Changeover Time ROI Calculation:
((45 – 27) * 10)/60 = 3 Hours saved per day
$75*3 = $225.00 saved per day($225 – $57.69)/$57.69 = 290% ROI
($96 – $5.76)/$5.76 = 1,567% ROI
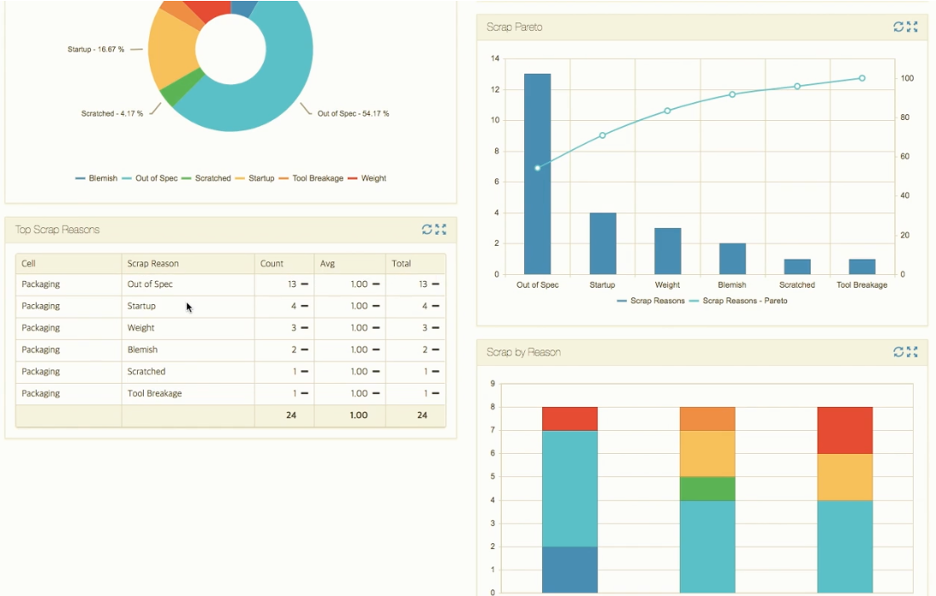
Quality improvements are typically easy to calculate. If you can reduce scrap by one or two parts a shift, what would that cost?
In the example below, we use the cost of the part at the time it finished on a certain operation. If you’re making a part that takes 3 steps to complete, the cost of scrap at step 1 is less than the cost of scrap at step 3. If you can catch scrap earlier in the process, it will reduce your costs.
Assumptions:
Quality Improvements ROI Calculation:
Savings: 11 * $21 = $231
($231 – $57.69)/$57.69 = 300% ROI
Built by people who know manufacturing, Mingo Smart Factory provides the 21st century “Smart Factory” experience that manufacturers need to grow in a modern environment. See how it can help you drive revenue.
© Copyright 2025 Mingo Smart Factory » Privacy