Mingo Logo Formerly SensrTrx
Search
Close this search box.
How much would a 5% OEE increase impact your business?

Uplifting the Bottom Line with OEE

In the manufacturing world, a few simple metrics can speak volumes about your operation’s true performance. Overall equipment effectiveness (OEE) is arguably the most powerful indicator in this realm and can have a tremendous impact on the bottom line.

This broad measurement rolls multiple critical factors into one top-line number — availability, performance and quality. In doing so, OEE provides manufacturers with a quantifiable score directly tied to their abilities to run lean, maximize asset utilization, and ultimately drive profitability.

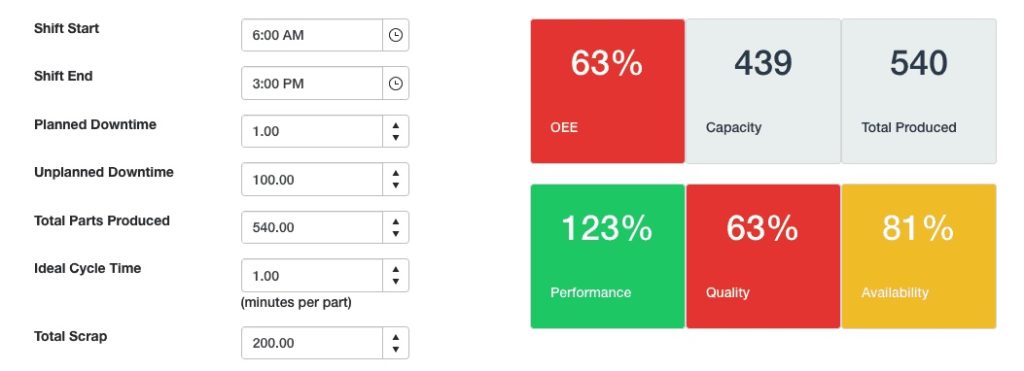
OEE Analysis Calculator

The Power of OEE Optimization

Think about it this way — if a manufacturer has world-class OEE scores across their plant floor, they’re extracting every ounce of potential from their equipment while minimizing losses from unplanned downtime, speed or quality issues. It’s the ultimate competitive weapon for managing costs and operating efficiently.

But without the capability to continually monitor OEE and its subcomponents in real-time, that razor-sharp insight gets dull quickly. You’d essentially be flying blind, reactively putting out fires rather than proactively improving operations.

Example 3: OEE Flawed Metric

Most Customers See ROI in 3 Months or Less

Fast to Implement, Fast to Install,
Fast Return on Value

Get the software up and running in days and immediately get visibility into the plant. The built-in Pareto Chart will help you identify where to start in the first week.

Built for Manufacturers, Not the IT Department

The system, scoreboards, dashboards, and mobile app are easy to set-up, easy to use by everyone from the operator to the plant manager, and can be maintained by current staff. No dedicated IT department required.

Software That Will Keep Pace With Your Growing Business

Mingo Smart Factory was built on the principle of continuous improvement. The customizable system will become more complex as data needs grow.

Trusted By Manufacturers Worldwide

A 5% OEE Increase Could Save Your Organization $200,000

Most customers see a ROI within the first 3 months. Mingo Smart Factory recently published an OEE Increase Analysis calculator that will show how much an OEE increase will impact your bottom line.

Sign up for a Live Demo

Curious to see how much you could save? Use the calendar to schedule a live demo of the calculator with a member of our team.

Sign up for a live demo

Curious to see how much you could save? Use the calendar below to schedule a live demo of the calculator with a member of our team.

OEE: The Financial Lifeline for Manufacturers

We don’t have to dig deep to uncover OEE’s tangible bottom-line impacts. Let’s start with the obvious upside of optimizing this metric — better production throughput and output.

When OEE climbs, it means your equipment is running longer, producing more quality parts per cycle, and operating closer to its theoretical maximum capacity. No surprises that increased throughput and velocity directly benefit profits. More widgets out the door in less time means more revenue opportunities. It’s that simple.

Conversely, companies plagued by unplanned downtime, inconsistent cycles and too much scrap are leaving serious cash on the table in the form of missed production, customer penalties, overtime costs, and other inefficiency taxes. And those hits to the bottom line are easily quantifiable when you’re tracking OEE.

Factory Worker Evaluating OEE

But OEE’s money-minding abilities extend far beyond just top-line throughput. It also provides the insights needed to optimize labor costs, material consumption, utilities, and virtually any other expense tied to production runs.

Lower OEE scores mean more cycles and runtime to produce the same marketable output. More cycle times equate directly to higher labor needs and costs to staff equipment. An increase in scrap and quality loss leads to repurchasing raw materials and dealing with excess inventory. Unplanned downtime burns money in the form of idling utilities and slows material turns.

When OEE is down, all these detrimental cost-bloaters add up quickly. But uplift the metric by finding and fixing the root causes? You squeeze new profit margins out of your existing assets and staffing model.

Is your plant ready to take the next step with manufacturing analytics?
Take the Smart Factory Assessment.

Cycle times are only one component of an efficient factory floor. Data-driven decisions start with automatic data collection, real-time visibility and manufacturing analytics.

This 20 question assessment will take about five minutes and show you:

  • What level of digital transformation your factory floor is ready for
  • Potential OEE increase working with a production monitoring system
  • Next steps for optimization

See For Yourself

A simple-to-use production monitoring system that will help you increase OEE on the factory floor. Schedule a free demo!

Mingo Smart Factory Production Monitoring